



ITLX Macro & Market Research
Oct 06, 2025
ITLX
Early - October 2025 Market View: Liquidity Breathes, Crypto Reacts
(Prepared by the InterLink Investment Research Team)
Executive Summary
As global markets navigate the early stages of a U.S. government shutdown and shifting central bank narratives, October presents a rare alignment of monetary easing bias, USD softness, and transient liquidity recovery. We retain a tactically bullish stance on crypto assets through the end of October, led by BTC strength, selective ETH normalization, and rotational inflows into SOL.
The macro data flow disruption from the U.S. shutdown is non-trivial: with major federal agencies halting releases, the data vacuum itself becomes the signal, forcing markets to lean on private indicators and model-based inference. In our assessment, this informational asymmetry amplifies dovish bias and increases the probability of preemptive Fed easing before labor-market deterioration becomes nonlinear.
1. Macro Backdrop: Policy, Data, and Perception
The partial U.S. government shutdown, now extending into its second week, has suspended data operations across the Bureau of Labor Statistics (BLS) and Bureau of Economic Analysis (BEA).
Consequently, pivotal macro data points—Non-Farm Payrolls (NFP), CPI, and GDP revisions—will be delayed, constraining the Federal Reserve’s decision-making bandwidth.
Without official guidance, investors recalibrate through private proxies such as ADP employment and regional PMIs. ADP’s latest release shows near-zero net private job creation, marking the slowest pace since early 2023 (see Chart 1).
This deceleration follows a steady three-year downtrend from the million-plus monthly gains of 2021, signaling labor cooling that dovetails with Phillips-curve logic: softer hiring reduces wage-led inflation risk over a 6–10 month lag, granting the Fed optionality to ease without jeopardizing price stability.
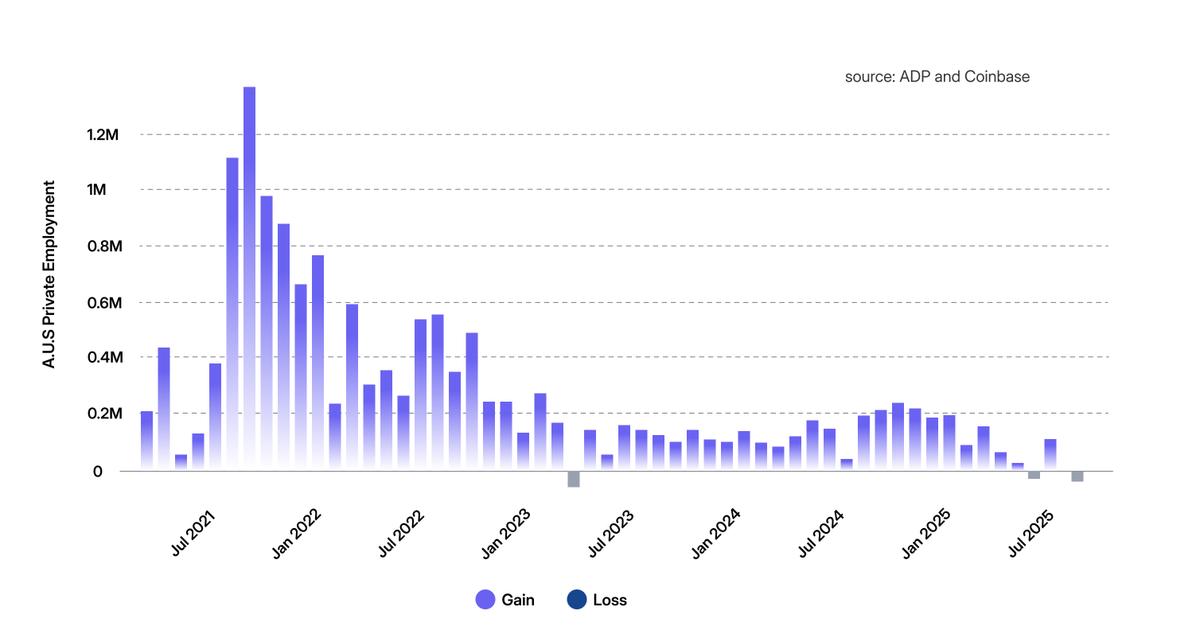
Chart 1: Monthly Change in U.S. Private Employment (ADP, 2021–2025). ADP data indicate minimal job creation at the margin, consistent with cyclical deceleration.
The intersection of data unavailability and labor deceleration forms a policy vacuum, a situation in which the absence of data implicitly encourages the presence of easing. Historically, similar episodes (e.g., 2013 sequestration) coincided with temporary liquidity injections as policymakers prioritized risk containment over precision tightening.
2. Liquidity Pulse: From Vacuum to Flow
September’s liquidity dynamics were distorted by a confluence of transient drains:
The U.S. Treasury rebuilt its General Account (TGA), reaching the target range above $800 billion;
Quarter-end and month-end flows tightened collateral channels;- Token2049 Singapore created a regional “conference liquidity vacuum,” as market makers temporarily rebalanced away from on-chain positions.
With these drains largely complete, October begins with systemic liquidity improvement visible in both cross-asset risk premiums and crypto market depth. The 3-month rolling change in global M2 aggregates turned positive in September for the first time since April, and U.S. reverse repo facility usage declined by over $100 billion—both indicative of early-stage liquidity re-expansion.
This mechanical easing sets a supportive backdrop for crypto, which remains one of the most liquidity-sensitive asset classes. Historically, 1-month changes in global M2 correlate with BTC price momentum at ~0.7 R² on a lagged basis.
3. The Fed’s Policy Function: Insurance Cuts and Market Repricing
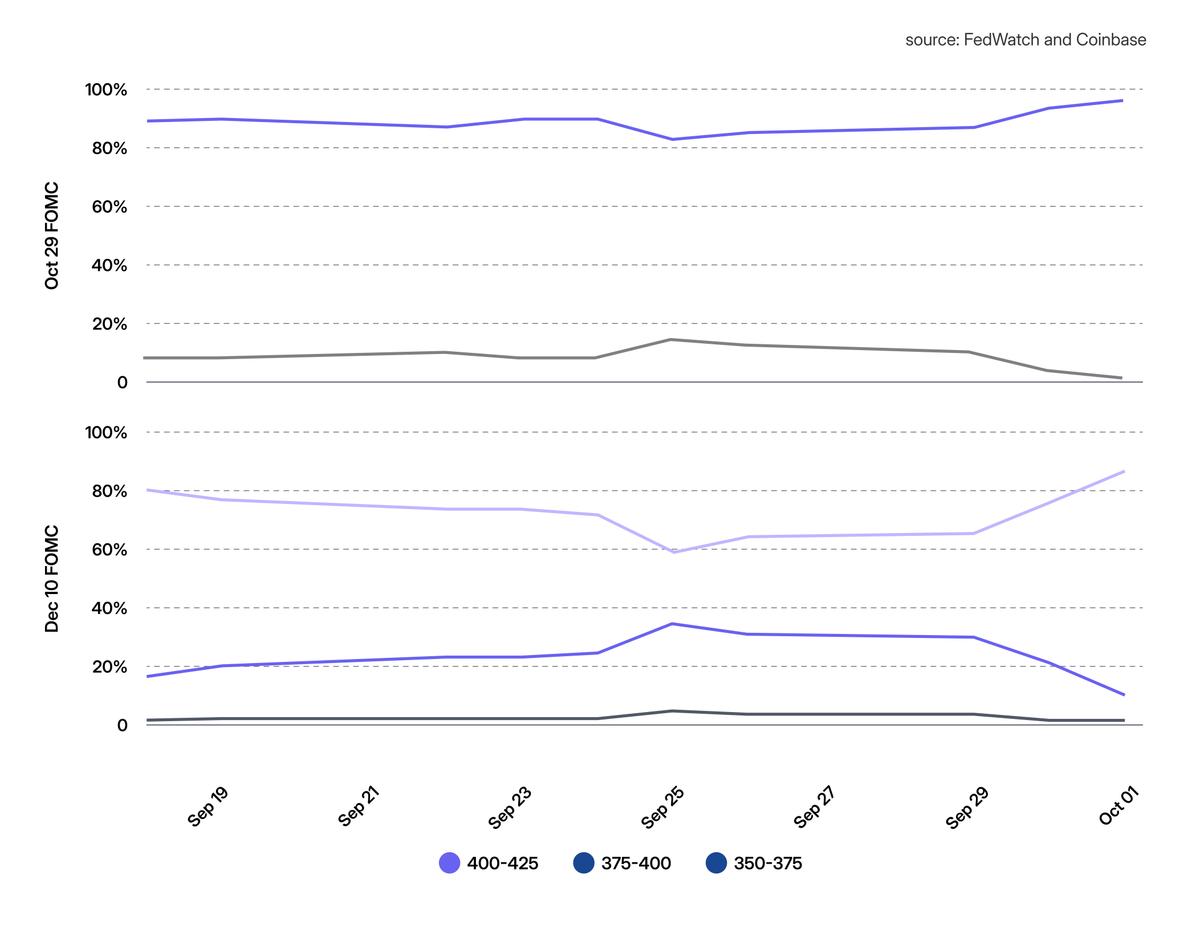
Chart 2: Probability of Two 25bp Rate Cuts by Year-End (Fed Funds Futures). Markets now price an 87% probability of 50bp total easing by December.
Fed Funds futures imply an 87% probability of two 25bp rate cuts by year-end, consolidating around a 3.50–3.75% target range by December. This repricing marks a pivot from the late-summer narrative of “higher for longer” toward “easing as insurance”, a policy posture that prioritizes stability over inflation orthodoxy.
Concurrently, the U.S. dollar index (DXY) has softened by ~3.5% from its September peak, while gold reached new all-time highs, signaling a lower real-rate regime and a renewed store-of-value rotation (Chart 3).
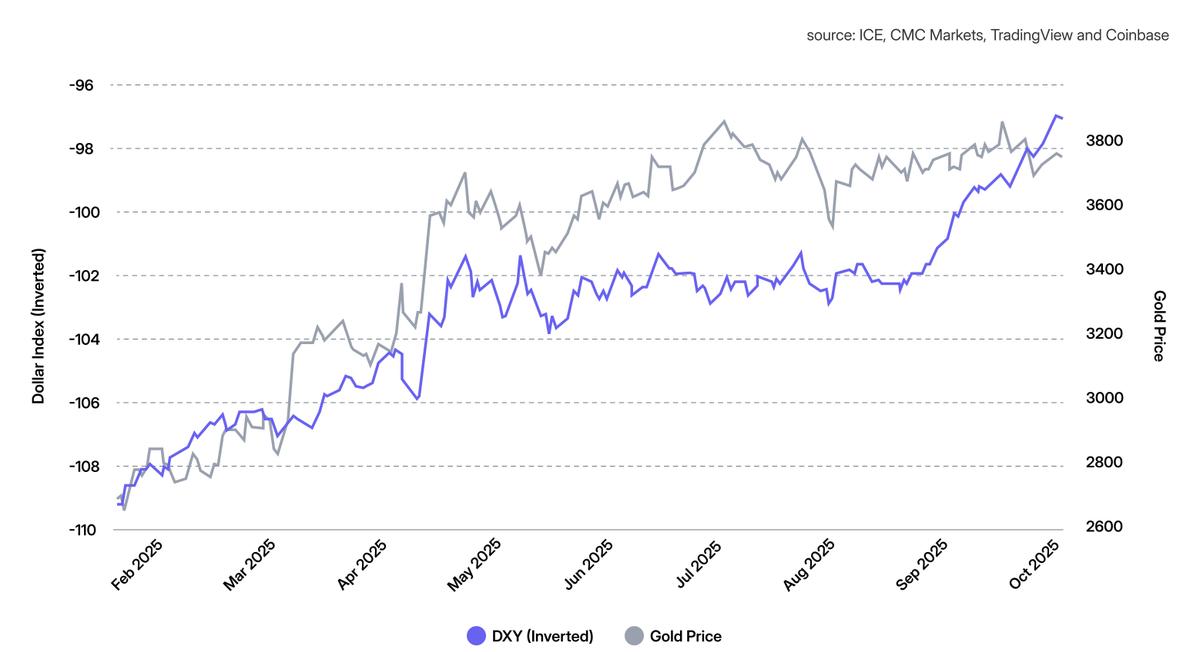
Chart 3: Gold vs. DXY – Divergence and Real-Rate Correlation. Gold’s breakout against a weakening USD aligns with falling real-rate expectations.
In macro terms, this creates a dual tailwind for crypto:
- Looser USD financial conditions reduce the opportunity cost of holding non-yielding assets like BTC and ETH.
- Reflationary bias drives portfolio reallocation into digital assets as both inflation hedges and alternative yield sources via DeFi.
4. Market Microstructure: Positioning and Depth Analysis
4.1 Bitcoin (BTC)
BTC remains the primary liquidity conduit within the crypto complex. Late-September order-book data reveal a reversal in spot market imbalance: buy-side volumes averaged $56 million/day, exceeding sell-side volumes of $42 million/day, marking the first net positive skew since July.
Long-term holder supply (LTH) versus short-term holder supply (STH) ratios remain stable, indicating non-excessive speculative positioning. This suggests that the current leg of BTC appreciation is structurally supported, rather than purely derivative-driven.
4.2 Ethereum (ETH)
ETH market depth stabilized in September, averaging $19 million per side within ±5% of midprice—up from August’s distorted profile driven by Digital Asset Treasury (DAT) purchases.
Perpetual and options open interest both declined modestly (~8–10%), reflecting risk compression rather than outflows. We interpret this as a healthy normalization, positioning ETH for volatility expansion once liquidity catalysts materialize.
4.3 Solana (SOL)
Spot SOL flows saw a measurable uptick, largely attributable to new SOL-dedicated DAT formations—a structural evolution that mirrors the “thematic treasury” model first seen in 2024 for ETH.
These treasuries represent institutional-grade allocators seeking programmable yield and composability advantages within the SOL ecosystem, marking an early signal of ecosystem capital differentiation.
5. Derivatives and Systemic Risk: Altcoin Open Interest Dominance
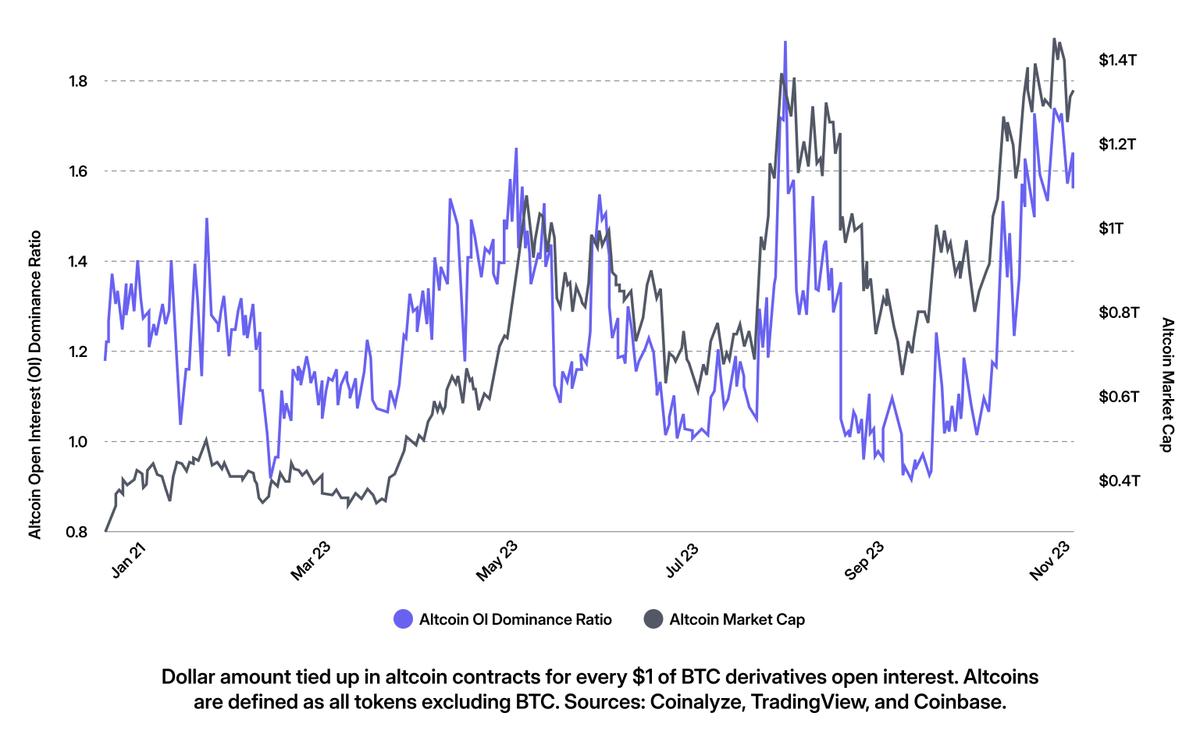
Chart 4: Altcoin OI Dominance Ratio (2022–2025). Ratio remains above 1.4x—historically a precursor to deleveraging events.
Despite ~$1.8 billion in forced liquidations during the final week of September, the Altcoin Open Interest (OI) Dominance Ratio remains elevated above 1.4x—historically the stress threshold preceding broad market deleveraging.
This sustained imbalance highlights latent fragility in high-beta segments of the market, particularly where perpetual funding rates remain positive but speculative positioning exceeds liquidity depth.
Our models flag this regime as “fragile bullish”—where upside continues under momentum, but marginal liquidity shocks can induce rapid mean reversion. Risk-adjusted exposure, therefore, favors BTC and ETH overweight while maintaining altcoin underweights until OI ratios normalize toward 1.0–1.2x.
6. Cross-Asset Context: Correlations and Regime Signals
Since early September, crypto-beta correlation to real rates (10Y TIPS yield) has inverted to -0.68, consistent with historical easing phases (2020–2021).
Meanwhile, the correlation between BTC and Gold has risen to 0.72—its highest in 18 months—underscoring the renewed store-of-value co-movement.
In contrast, equity correlations (BTC–NASDAQ) have fallen below 0.35, reflecting crypto’s partial decoupling from equity risk amid macro-driven rotations.
7. Forward Outlook: From Tactical Rally to Structural Rotation
The near-term crypto setup remains tactically constructive through October:
Macro tailwinds from softer USD and easing bias persist.- Liquidity compression has reversed, and market depth is improving.
- BTC positioning remains moderate, providing room for continuation.
However, November presents emerging headwinds:
Fiscal impasse may extend, constraining policy clarity.
Treasury issuance could absorb liquidity if deficit ceilings are lifted.
Altcoin leverage remains above comfort thresholds.
Accordingly, we anticipate BTC-led upside toward mid-November, followed by selective consolidation as liquidity tailwinds fade. For allocators, this represents an optimal window for rotational positioning—accumulating BTC and ETH exposure while de-risking illiquid altcoin positions.
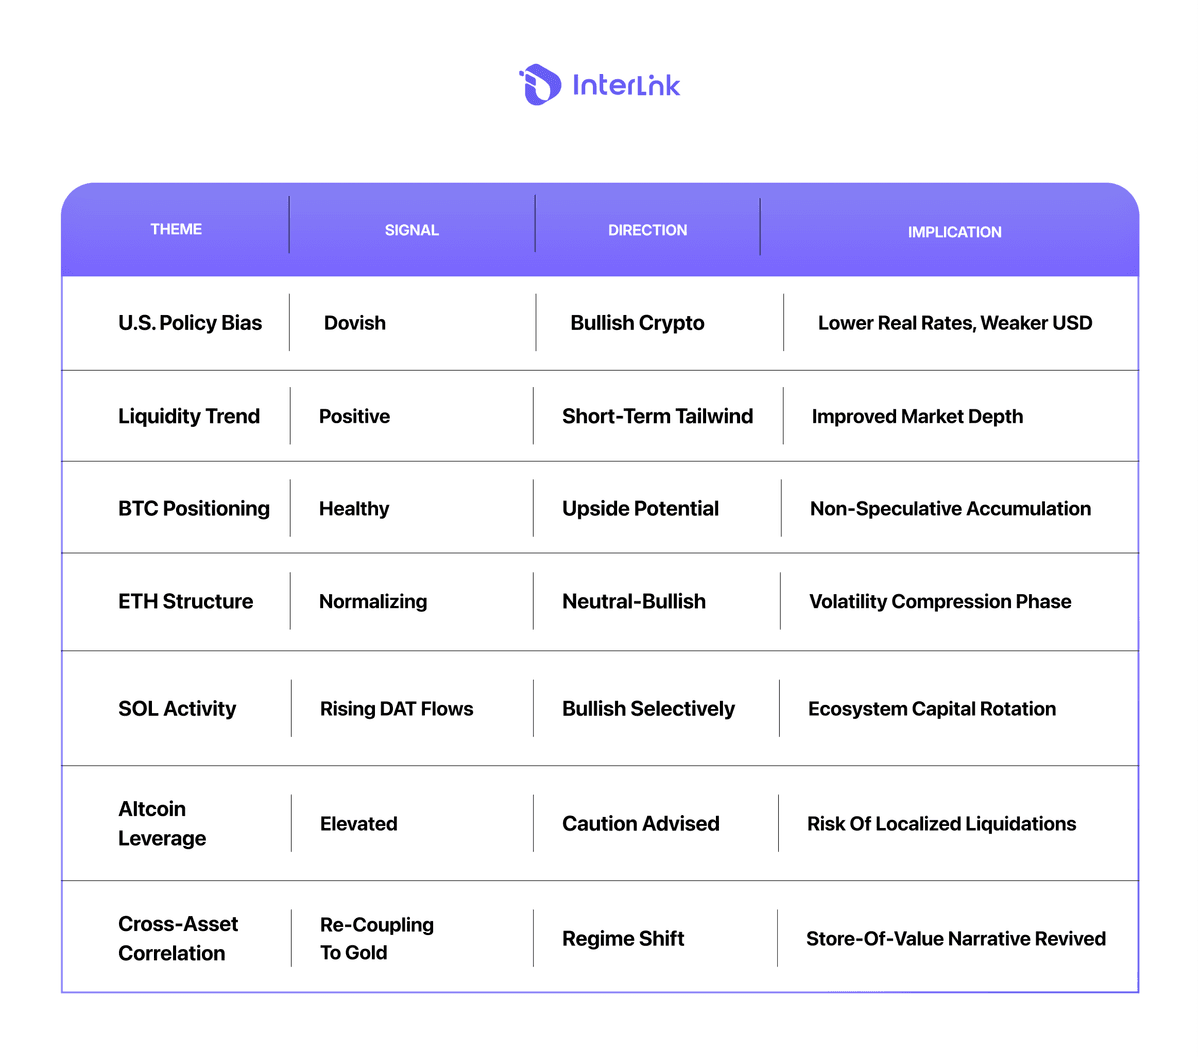
8. Summary Table: October 2025 Macro-Crypto Outlook
Conclusion
The October landscape is one of transitional liquidity—a moment where macro easing expectations, data opacity, and crypto microstructure align in favor of upward repricing.
BTC’s leadership appears intact; ETH is preparing for structural reacceleration; and SOL represents the early front of institutional experimentation within Layer-1 differentiation.
Altcoins, however, remain fragile passengers on a volatile liquidity tide.
The overarching narrative is simple: when liquidity breathes, crypto reacts. But the lesson remains technical—sustainability depends on structure.

